How did vaccination progress differ?
The project examined global vaccination progress, differences between income groups, country coverage and the relationship between GDP per capita and full vaccination coverage.
The aim was to make these patterns accessible through an interactive Tableau dashboard. Coverage, daily dose activity and economic context answer different questions, so each needed a distinct view.
Build comparisons with clear denominators.
- Clean and validate the supplied data. Review dates, missing values and the fields used for coverage and daily vaccination activity.
- Separate countries from aggregates. Use the World series for global trends and income-group series for group comparisons, rather than adding overlapping aggregates.
- Choose the right measure. Distinguish people fully vaccinated per 100 from the number of vaccine doses administered.
- Create focused Tableau views. Combine calculated fields, KPI cards, filters and charts to explore time trends and differences between groups.
- Examine the GDP relationship. Compare available country-level GDP and coverage observations using descriptive linear regression, with attention to reporting dates.
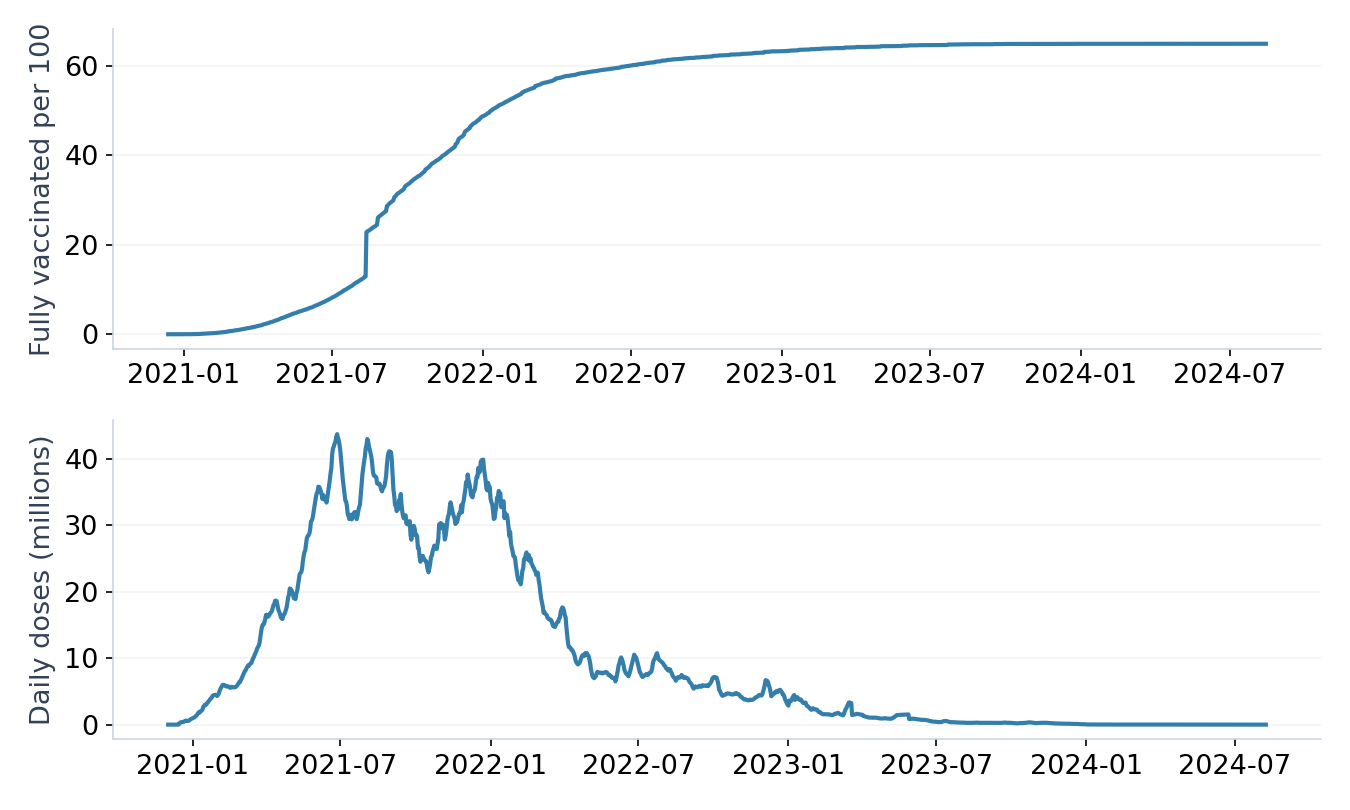
Global coverage tells only part of the story.
The World series reported 64.93 fully vaccinated people per 100 on 14 August 2024. That historical value summarises global coverage, but it does not show how evenly coverage was distributed.
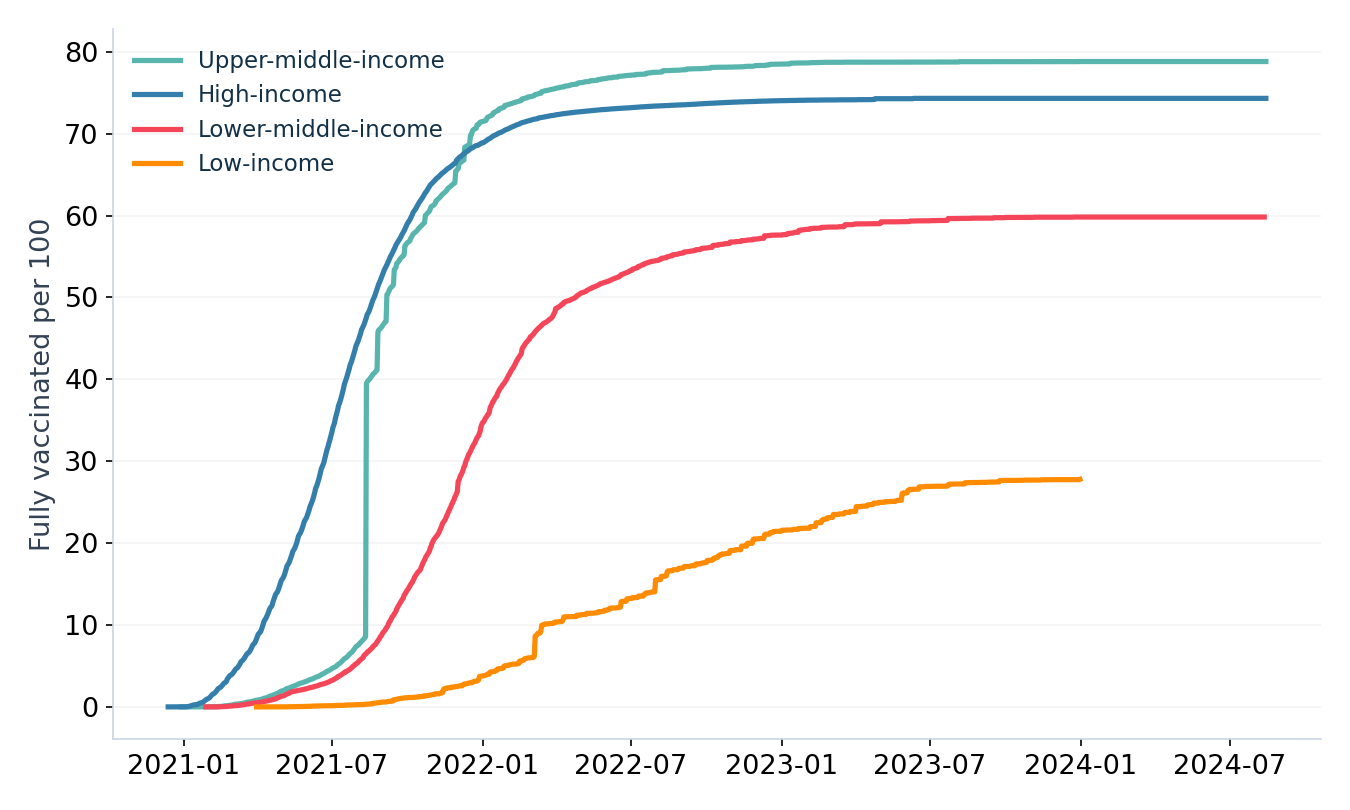
Income groups followed different trajectories.
Coverage differed substantially between income groups. Viewing the trajectories together makes those differences visible, while also showing that progress unfolded over time rather than at a single common reporting date.
GDP was associated with coverage.
The country-level analysis included 189 countries and found a positive association between GDP per capita and full vaccination coverage, with R² = 0.328.
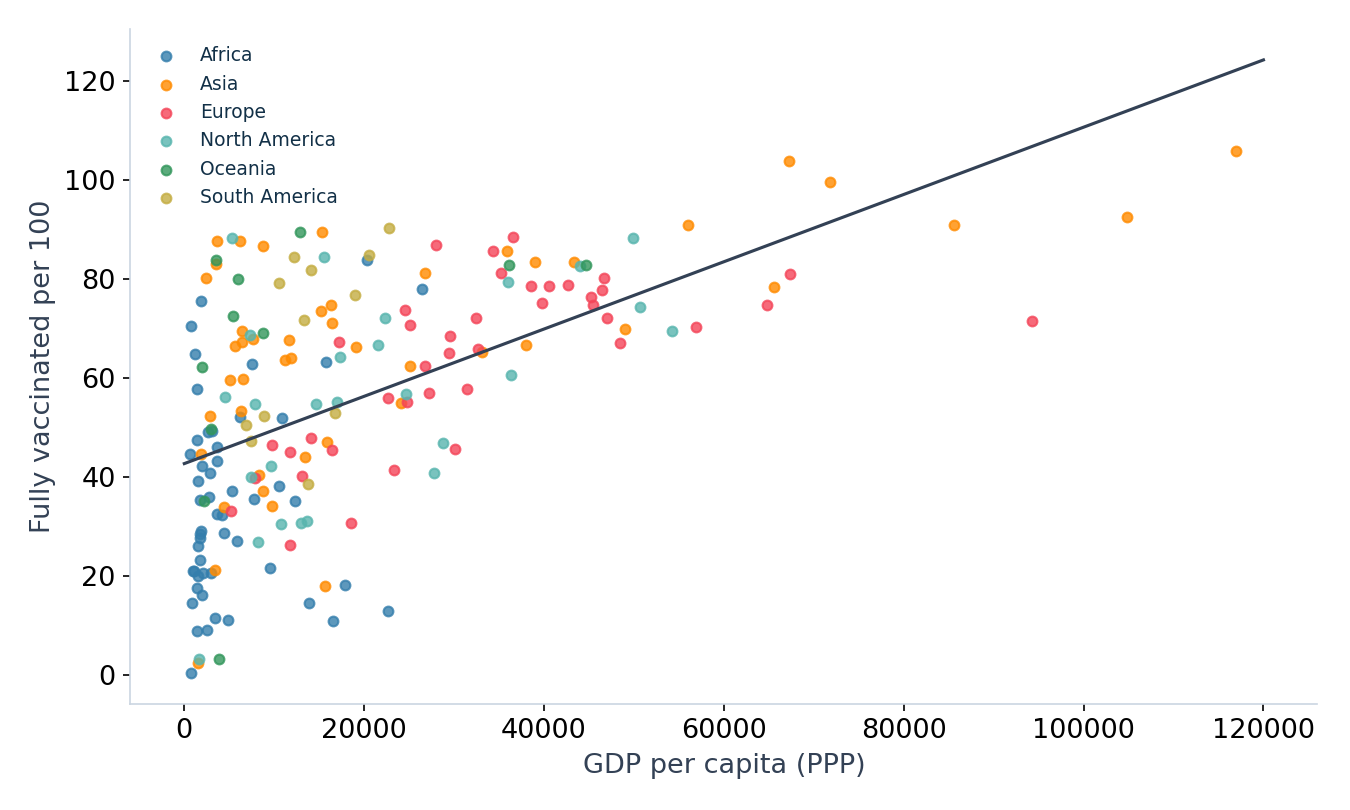
The fitted linear relationship accounted for about 32.8% of the observed variation in coverage in this sample. It does not show that GDP caused that variation or establish why individual countries differed.
Keep the reporting context visible.
| Issue | Implication |
|---|---|
| Historical snapshot | The dashboard does not describe current vaccination coverage. |
| Different reporting dates | Latest available country values are not necessarily measurements taken on the same day. |
| Missing observations | Countries or periods with incomplete reporting may affect comparisons. |
| Coverage above 100 per 100 | Reported values require investigation of denominators and reporting conventions before interpretation. |
| Unadjusted regression | The GDP relationship does not isolate other influences or establish causation. |
Economic context can help frame questions about unequal coverage. Explaining the differences would require additional evidence on access, rollout timing, health systems, reporting and other relevant factors.
Explore the work behind the findings.
This capstone demonstrates data preparation, visual analytics, calculated fields, dashboard design and cautious regression interpretation. The interactive dashboard lets visitors explore the underlying views; the repository provides the packaged Tableau workbook and presentation.
Data and project sources
Our World in Data COVID-19 dataset, supplied for the course capstone; completed Tableau workbook and project presentation. Charts on this page were recreated from the project’s cleaned dataset.
*The global KPI refers to 14 August 2024. Country and income-group observations can have different latest reporting dates.